
Grafana dashboards and alerts
This page describes how to install and configure Bufstream's Grafana dashboards and alerts.
Downloads
| Dashboard | Description |
|---|---|
| bufstream-grafana-v0.3.6.zip | Bufstream dashboard .json and alert .yaml files for Grafana |
About the dashboard
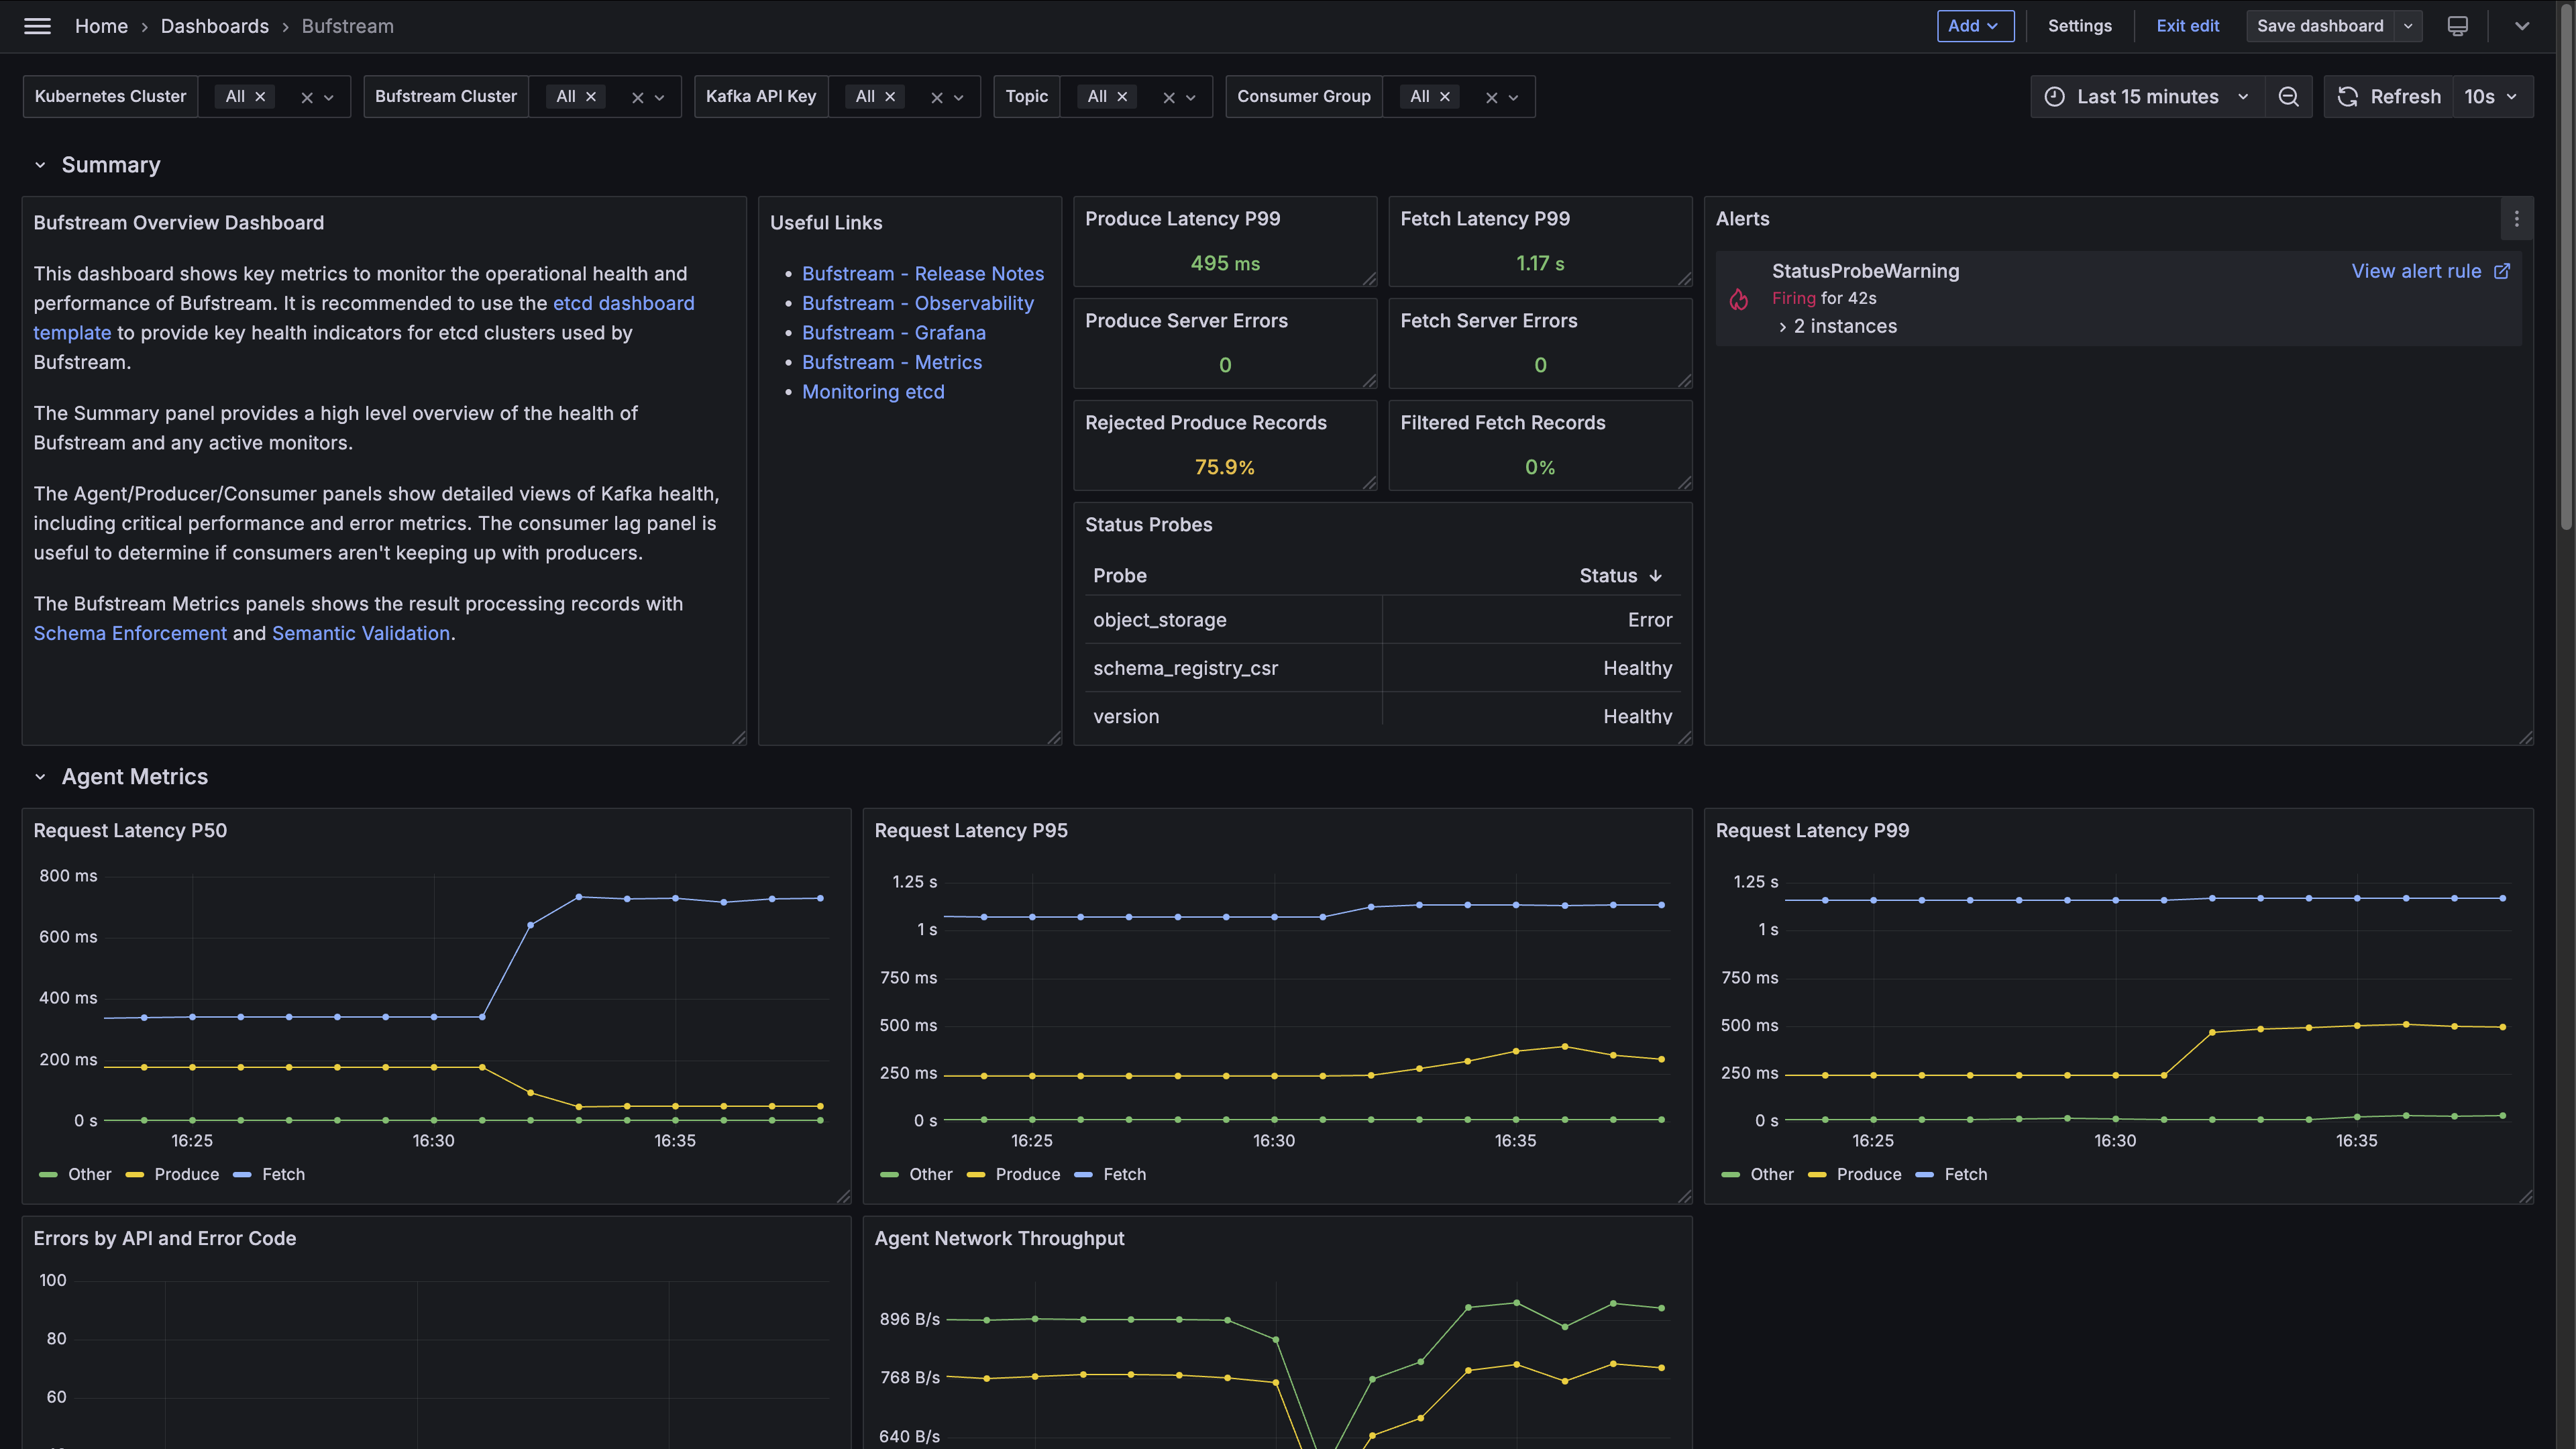
The overview dashboard (grafana-overview-dashboard.json) provides an Overview row for high-level Bufstream status and rows of panels for Bufstream brokers, Kafka Producers/Consumers, Bufstream metrics (including data governance), and etcd metrics.
Top-level label drop-downs allow filtering by the Kubernetes cluster, Bufstream cluster, Kafka API key, topic, and consumer group.
About the status alert
The status alert (prometheus-status-rules.yaml) fires when any Bufstream broker's status probes report alerts. If any Bufstream broker is in an unhealthy status, it reports an alert to the status probe. This monitor is based on the bufstream.status metric.
Installation
Dashboard
To import the dashboard, follow Grafana's instructions, using dashboard-overview.json.
The dashboard exposes its overall health status to aid in identifying and diagnosing operational issues.
Alerts
Add the rules in prometheus-status-rules.yaml to your deployment, which should look something like this:
serverFiles:
  alerting_rules.yml:
    # rules from prometheus-status-rules.yaml
Configuration
When using Grafana, Bufstream metrics can either be scraped at a Prometheus endpoint or pushed to a collector.
Prometheus
If Bufstream is configured to expose a Prometheus endpoint, metrics can be scraped at https://0.0.0.0:9090/metrics/.
We recommend setting pod annotations for the Bufstream pods. Specify the annotations in your Helm values file:
bufstream:
  deployment:
    podAnnotations:
      prometheus.io/scrape: "true"
      prometheus.io/path: "/metrics"
      prometheus.io/port: "9090"
OTLP
If you've configured metrics to be exported in OTLP, an OLTP-compatible collector such as Alloy is also needed.
etcd
To monitor etcd, you may need to enable metrics for your etcd deployment. For etcd dashboards, see etcd's recommended template.
Release notes
v0.3.6
Release Date: 2025-01-14
- Update dashboards to use new fetch and produce request metrics instead of previous errors metrics.
v0.3.3
Release Date: 2024-12-19
- Initial release of Grafana dashboard and alerts for Bufstream.